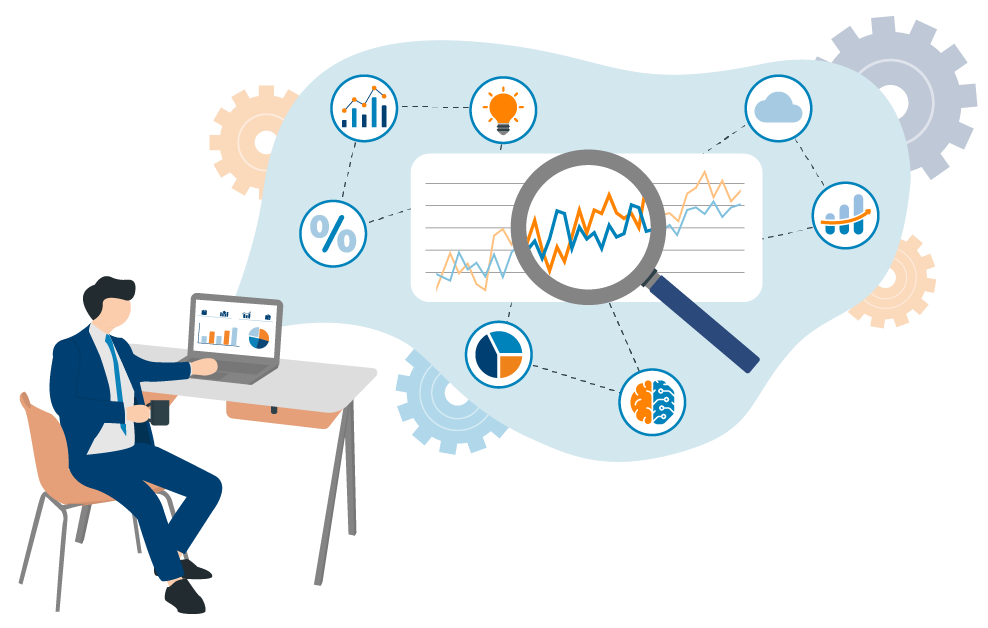
What is BI in the context of corporate performance management?

A complete corporate performance management (CPM) system includes business intelligence (BI) and analytics. It is used to make corporate decisions on the basis of facts.

Data is the basis. In the right structures, they become information. Information based on actual data are facts.

For this purpose, BI combines the following subdisciplines:

  • data acquisition
  • preparation and presentation of the data, including data visualization
  • data analysis, i.e. gaining insights and making them usable for the strategic positioning of the company

In contrast to planning, budgeting and forecasting, BI looks back at the past from today's status. The plan has been approved, implementation has started, a certain period of actual data is already available.

After data collection, it's now time for reporting and dashboarding. What is happening in the company? What is going on in the markets? In most cases, BI reporting shows that some relevant numbers are developing differently than expected.

Now what?

The analysis reveals what's behind the figures in order to understand the causes and derive recommendations for action from these findings.
 

There are two motivations for dealing with plan deviations:

Either things are going badly and a course correction is necessary. Or something is going surprisingly well and you want to take advantage of the opportunities that have arisen – to strengthen your strengths. The latter is an often overlooked lever in business analysis to achieve positive business results. Action is needed in both cases.

Business intelligence software helps answer the question: Why does the actual state deviate from the plan?

Corporate Performance Management – Serviceware Performance.


Was the plan unrealistic?

Has there been a problem with implementation? Where exactly?

BI reporting doesn't just provide the bare numbers. A software-supported BI system enables ad hoc analysis.

Example Drinks SE: The drilldown for immediate answers in self-service

At beverage manufacturer Drinks SE, the result for EMEA is 20 percent smaller than forecast for the first quarter. Sales figures are developing as expected, and fixed costs are stable.

Where does the imbalance come from?

A drilldown shows that the contribution margin for juices has been below average. Broken down into product groups, it quickly becomes apparent that the costs for producing apple juice have exploded.

What's going on here? Two seasons of weather-related crop failures at various suppliers in Northern Europe have driven up raw material prices.

Drinks SE had actually hedged against this with supplies from New Zealand. However, the container ships carrying the apples are stuck in traffic jams off China's ports. Drinks SE bought in Italy at short notice for a hefty surcharge.

Now that the context is clear, the company can address the real core questions:
Is this a temporary problem? Or does Drinks SE need to reposition itself for the long term?

Which scenarios are realistic?

A BI system brings decision-makers immediately to the root causes of business problems.

What is the difference between business intelligence and business analytics?

There is no generally accepted definition in the industry for either term. To a large extent, both are used synonymously.
 

Business intelligence

Business intelligence is the older term and for a long time referred to classic reporting and dashboarding – the presentation of current and historical data.

Business analytics

Business analytics is somewhat more modern and emphasizes the craft of analysis: getting to the bottom of individual aspects of a subject as a whole by means of systematic investigation. Business analytics aims to uncover and understand what is hidden beneath the surface.

Data in context – the right frame of reference

In isolation, the figures from business intelligence reporting don't mean anything.

"We make 26 million Euros in sales." Is that good? Or bad?

That depends on the context of these numbers.
 

1. A look into the past:

How do the numbers compare to recent periods? "That's 12 percent growth over the previous year." This statement puts the figures in the context of past developments and thus offers first insights.
 

2. What was the plan? What are our goals?

What were we going for? What did we set out to do? If 20 percent growth was planned, 12 percent is insufficient. If, on the other hand, only 2 percent growth was planned, 12 percent is very good.
 

3. How is the market moving?

Despite disclosure obligations and market research institutes, data is insufficient for a detailed analysis of competitors' figures. But if the competition generates 40 percent growth in the market, my 12 percent are bad. If, on the other hand, the competitors report negative growth numbers across the board, then my own 12 percent is above average.
 

Actionable reporting: every report must trigger an action

An essential aspect of business intelligence is to prepare and communicate the insights gained in the analysis. This goes beyond sharing knowledge. The target group, i.e., the management, must understand the message and be able to derive actions from it. Otherwise, the "intelligence" won’t have any effect on the "business".

When it comes to the question of how the data must be prepared, preferences between management and controlling often diverge. Here, much can be learned from the discipline of visual information design.

Controllers do not trust diagrams as a matter of principle. They are focused on facts and want to understand the origin of the information and be able to interpret it themselves.

For controllers, the only legitimate use case for pie charts is election night.


But as much as controlling likes to focus on numbers, it is not practical to inflate reporting for decision-makers with appendices full of columns of figures.


Dashboarding

A business intelligence dashboard must provide an overview of the most important key figures in one view. This requires a clear definition of which target group uses the dashboard for which purpose ahead of time. Otherwise, you will quickly have 30 key figures, graphs and pie charts on one page, but neither the complete picture nor the factual basis for decision-making.

The rule here is: validation through usage. Numbers that no one misses when left out don't belong onto the dashboard. Graphical elements that are not part of the main statement also have no place on the dashboard.


The 3 classic ways of preparing data in reporting

1. In a table (tabular):

Excellent for comparisons. But beware: sometimes suggests a comparability that does not exist and tempts to display too many figures without any call to action.

2. Graphical:

With the right focus on the message, classic business charts are very helpful. However, if they are only pretty, but lack meaningfulness, then they have little chance of influencing the course of action.

3. As text:

What the numbers and trend lines actually mean and how little is self-explanatory becomes apparent when the facts have to be summarized in continuous text and written out as a decision-making basis for management. The events have to be summarized verbally, the context explained and the potential decision options shown.

Contextualization: This is the added value that controllers will always deliver, even as BI software, machine learning, and AI increasingly relieve them of the tedious clicking tasks.

Important for the BI software comparison: What does a good BI and analytics tool need to deliver?

The biggest challenge for business analytics is data integration: bringing together data from different sources, systems, and formats to gain insights. The best BI software ensures first-class data quality with reliable data integration.
 

A business intelligence system provides the following features:

  • consistent data: across different periods and systems with different file formats
     
  • correct data: the numbers are right
     
  • well prepared data: the context is understandable
     
  • current data: available when needed for decision making  
Eine Gruppe Menschen in einem Besprechungsraum.

A real-world scenario:

Controlling has submitted the report with the current business figures to the operational management as a basis for decision-making at the board meeting. Actually, this was done a week and a half ago, but the manager only got around to preparing for the meeting today. Now he stumbles across an inconsistency in the report and has questions. Are we sure the numbers are right? Where does the discrepancy come from?

a) This is how it goes without a good BI solution:

A phone call to controlling. Hectic activity. First, the check whether the formulas in the spreadsheet are working as they should. Then the double check to see whether the figures match the data in the source systems – or were they just transferred incorrectly? This drags on, but everything seems correct. So let's dive into the analysis and deduce how the discrepancy came about.

Like in a virtual warehouse, controllers pull one folder after the other from the digital shelf, look inside, don't find what they're looking for (most of the time), and move on to the next folder. To ensure that the extended report is ready on time, the night calls for working longer hours – again.

b) This is how it works in a company with reliable BI software:

In this case, the manager doesn't even pick up the phone. Either he goes into ad hoc analysis himself – from a bird's eye view drilling down into the details – and simply finds his answers via self-service business intelligence (self-service BI or SSBI).

Or the analysis, including the relevant context, is supplied by the controlling department right from the start. If the controlling department spends less time on error-prone copying and reformatting of data from one system to another, manual data integration and preparation, there will be more time for the exciting questions and analyses. Then the experts can tackle the big problems and prepare their reports as an elaborate basis for decision-making.

And if the call from management does come in? Then, of course, the convenience of self-service applies here as well. The analysis is run quickly, and the report completed easily.

Data warehouse, data lake, data mart and databases

What distinguishes a data warehouse from simple databases is that it imports and integrates data from various sources and systems from all business units and corporate divisions, so that the data is available in a standardized, consistent file format ready for ad hoc analysis.

This is also the decisive difference to a data lake, in which large volumes of data (big data) are also available – often in the cloud, but as unstructured raw data or in a wide variety of formats, which makes comparisons and analyses possible only after further processing steps.

A data mart is usually a subset in the data warehouse that integrates data only for a specific business unit or stakeholder audience. Data marts are often designed in the context of permission-role concepts to limit view, access, and complexity in data warehousing. However, data marts can also be conceptualized and built bottom-up without a data warehouse umbrella.

A BI system, especially a business intelligence cloud, where you want to get instant analysis results and insights for business decisions from big data, works best based on the data warehousing concept.

Machine learning (ML) and artificial intelligence (AI) in business intelligence (BI)
Within the cloud context, it is becoming increasingly cost-effective to create and manage comprehensive data sets.

The higher the number of data streams that can be integrated into uniform, consistent formats that can then be aggregated, the more helpful it becomes to assist human intelligence with machine learning (ML), artificial intelligence (AI), and big data analysis.

This promise was once held out by data mining – a separate discipline that has failed to catch on in enterprises. AI now seems to be delivering on that promise.

When it comes to pattern recognition – including the detection of pattern deviations – and the examination of huge data sets, algorithms have an edge over humans. When it comes to evaluating individual risk scenarios under conditions of uncertainty, on the other hand, people with expertise and experience achieve better results.

At this interface, (wo)man and machine complement each other perfectly. BI software creates the sound factual basis to reflect reality as well as possible. Controllers develop scenarios based on this foundation and provide recommendations for senior management so that executives can make the best possible decisions.

Online demo

Book a demo or start a free trial today

Book a personalized demo with our expert consultants today to see what our solutions can do for you.